There are various scenarios where it makes sense to add a graph or chart to a website. You might want to publish results of a survey for instance, add financial charts or just communicate some data with your visitors in a professional way.
If you want to embed a chart into your website you have the following options
- Learn and use a chart library such as Chart.js
- Use a chart and graphs extension if using a CMS such as WordPress, Joomla etc.
- Use a WYSIWYG chart and graph solution
- Include the chart as image
We will now look at these options in more detail and explain step by step how you can add a chart to a website or blog. We will also cover advantages and disadvantages. There are also some challenges around dynamic charts that should update periodically once new data is available.
Libraries to Embed a Chart into a Website
There are various JavaScript libraries that you can use to add graphs and charts to a blog or website. A drawback of using such charting libraries is that you need to spend a bit of time to reasearch which library is the best for your use case. Once you decided on a library, you need to spend a bit of time to read the documentation of the library and understand the API before you are able to create a chart. The graph and chart libraries that I have listed here are based on JavaScript. Some of them are open source and free to use whilst others offer a paid solution to publish charts on a website.
Since there are plenty of chart libraries you might find it difficult to decide which one to use. The following questions might be a guideline when making a decision:
- Are you willing to pay some money towards a chart solution for better support or would you rather want a free chart solution?
- Which chart types would you like to add to your page? Are those types supported by the library?
- Do you like the default design of the chart library?
- Do you need special functionality for your website charts?
There are a couple of popular chart and graph libraries that are widely used across the web to include graphs and charts in a website.
Chart.js
Chart.js is a open-source Java-Script based library that you can use to create a HTML5 chart for your website. There is a great documentation available on Chart.js that you can follow along to get started. However, you would need some knowledge of JavaScript and you need to be willing to learn the Chart.js API.
Highcharts
Highcharts is another JavaScript library to create and add charts to your website. It has similar functionality when comparing it with Chart.js. However, the license model is slightly different: It is free to use for personal or non-commercial use. There is a paid solution for commercial applications.
Google Charts
Google offers its own framework to publish charts on a website. Google's solution is free to use and currently supports around 18 different chart types.
jqPlot
jqPlot is a plugin for the jQuery Javascript framework. If you run a website and already use jQuery then it might be worth to look at this plugin. It is open source software released under the MIT or GPL license.
D3.js
D3.js is a JavaScript library focusing on data visualization on the web with many use cases. It does not only support charts but also other visualizations such as networks and hierarchies. It also allows great animations which can really make your charts stand out from the competition.
Plugins and Extensions to Create Web Charts
Are you using a content management system such as WordPress or Joomla to power your website? For most of such software solutions there are extensions and plugins available that you can use to add a chart to your website.
The disadvantage of CMS-specific charts and graphs extensions is that you won't be able to migrate to a different CMS unless you also switch the charts extension. This might cause additional work if you decide to switch to a different CMS in the future.
No Coding Graph and Chart Solutions
There are also many solutions that allow you to build a chart in a special editor without any programming knowledge. You just need to copy the code into your website which simplifies the process and typically reduces the time that you need to publish a chart.
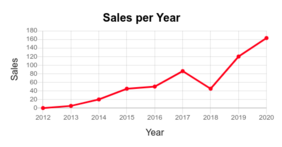
Adding a Chart as an Image
An easy way to publish a chart on a website is to include an image. You can use any software to create a chart, take a screenshot and embed it in your website. This is very easy from a technical perspective.
However, there are various drawbacks: First of all charts are not responsive. Of course you can make the image responsive so that it adapts to the available space but a responsive web chart would also adapt axis ratio etc to best fit on different screen sizes for maximum of responsiveness. Static images of a chart do not allow any user interaction such as hovering values or zooming. It also not possible to include chart specific animations. Whenever your data changes, you would need to take a new screenshot and upload it to your web server to refresh your chart. Images of a chart are not suitable at all for dynamic and real time charts.
Handling Dynamic Data in Charts
A bigger challenge is a scenario where you would like to include a chart that is updated periodically with new data. Such real time charts are slightly more difficult to realize. Some of the chart extensions include connectors to database tables so that you could automatically pull latest data on every page request.
If you need any assistance with publishing a chart on your website or if you are looking for a specific chart solution - please do not hesitate to contact us.