Presenting Data in HTML Tables
The HTML scripting language includes the table tag which allows a webmaster to include tables on a website. A table is obviously a good candidate to present data, they key is here to keep the table simple so that your visitors can quickly read the table and grasp the relation in the data without much effort. The bigger the table the more effort your visitors need to put in to understand it. Sometimes it is beneficial to break up a larger HTML table into smaller ones which helps your visitors to grasp the content. Also proper styling should be used and applied to the table.
Presenting Data in a Chart
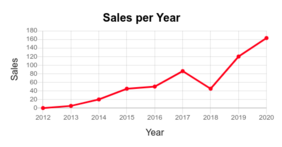
Charts are a very powerful tool to present data and quickly illustrate relation in data. There are various chart types such as scatter plot, line chart, bar chart or pie chart for instance.
Using Screenshots of a Chart
Many website owners include screenshots of charts into their website. The process is as follows: The chart is often created with software like Excel or LibreOffice, a screenshot is taken and the image file is then uploaded to the webserver and included via image tag into the website - like any other image. There is no need to include any other dependencies, in the end the process of adding a chart screenshot onto your website is as simple as adding any other image.
However, there are also disadvantages: Chart images might have a negative impact on page loading speed, especially when using high resolution images. Another drawback is that there are no chart animations possible, like zooming into a chart or pan. The chart image is static.
Using JavaScript based Charts
The alternative is using JavaScript based charts for the web. Example of open source libraries are chart.js and morris.js. In this case you need to include a small JavaScript library into your website and the chart is then rendered on your visitor's device.
PrettyCharts.com offers a powerful chart configuration tool that allows to create web charts without programming skills. They also provide functionality to convert tables into web charts or derive web charts from screenshots. If you don't plan to learn the API of a chart software then this could be a powerful way to get started with including charts into your website.